“The market is filled with individuals who know the price of everything, but the value of nothing.” – Philip Fisher
In the world of crypto Trading, support and resistance are key for traders. They help understand market trends and make smart trading choices. Support is a price floor that stops prices from falling further. Resistance is like a ceiling that stops prices from rising too high.
These ideas are crucial for both new and experienced traders. They help them grasp market dynamics and create effective trading strategies. A top crypto proprietary trading firm or platform, like HyroTrader, offers platform on Bybit to apply these concepts well.

Crypto Trading Support resistance
Key Takeaways
- Support and resistance are key price levels that affect buying and selling in the market.
- Historical price data and psychological price levels like round numbers often define these zones.
- High trading volumes at support or resistance levels show stronger market significance.
- Using support levels can help in setting strategic stop-loss orders to manage risks.
- Breakouts and breakdowns signal significant price movements, guiding trade entry and exit points.
Understanding Support and Resistance Levels
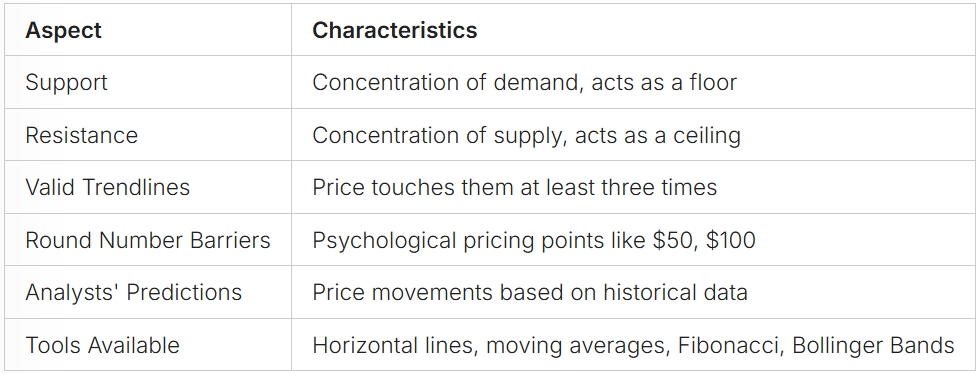
Support and resistance levels are like a map for crypto traders. They show where a trend might stop or change. Support is where buyers step in to stop a price drop. Resistance is where sellers make it hard for prices to go up.

Crypto Trading Support resistance
Looking at past prices helps us spot these key levels. Assets often pause or change direction at these points. Trendlines are useful if the price touches them three times. Round numbers like $50 or $100 can be strong barriers because they’re easy to remember.
Many traders put orders at these numbers, making them even stronger. This makes these levels crucial for predicting market moves.
Experts use these levels to forecast price changes. If a price breaks through a resistance level, it could go up a lot. If it drops below support, it might fall further. This shows how traders feel about the asset.
Analysts often predict that breaching critical support or resistance levels could significantly influence market trends in crypto, acting as a signal for near-future price movements.
Traders use different methods to spot these levels. They draw lines, use moving averages, and look at Fibonacci levels. These tools help guess where prices might go, but they’re not always right.
Crypto Trading Support resistance
Why Support and Resistance Matter in Crypto Trading
Support and resistance are key in crypto trading. They show where a lot of buying and selling happens. Knowing these levels is vital because they can stop price changes in their tracks.
Support is where prices stop falling because of more buying. Resistance is where prices stop rising because of more selling. These levels help traders make smart choices. They buy at support and sell at resistance to make the most of the market.
Using these levels well is key to managing risk in crypto trading. They help traders know when to enter or leave the market. This helps manage risks and understand the market better.
Finding these levels can be hard because the market changes a lot. If they break, prices can move a lot. To be safe, traders use more tools and studies to help their trading plans.
Support and resistance also affect traders’ minds. Fear and greed make prices move towards these levels. This makes them important for making decisions.
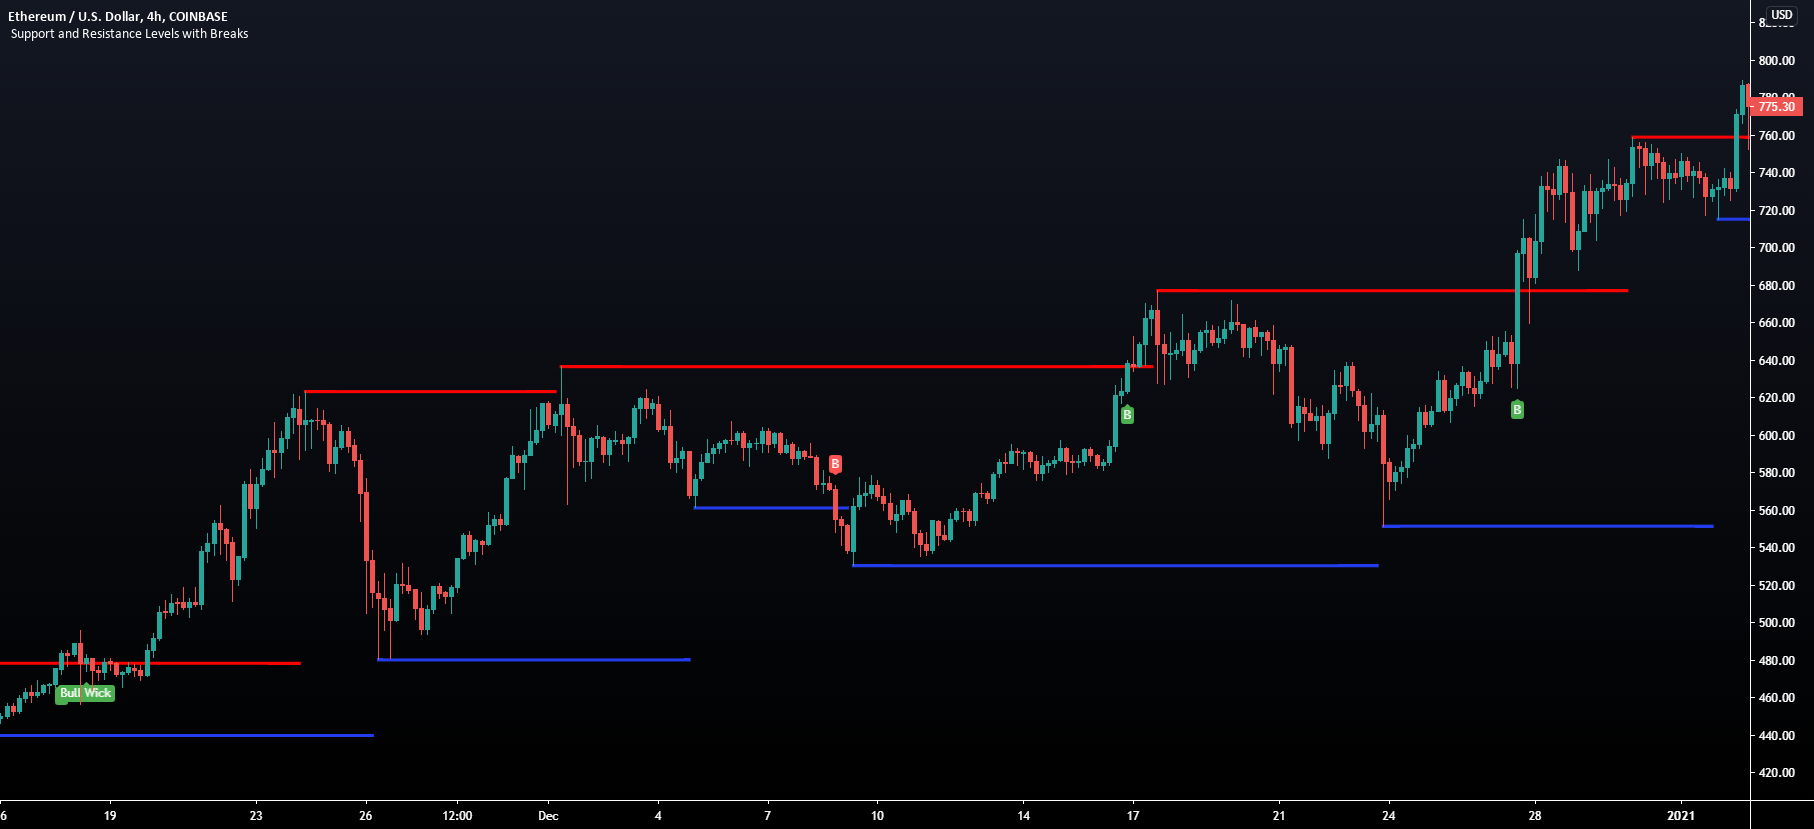
For instance, Bitcoin hit resistance at $28,000 and support at $25,000 recently. When it goes past these levels, it shows strong buying or selling. This shows how the crypto market is always changing.
How to Trade Support and Resistance in Crypto
Trading support and resistance levels need strategies that match market trends. These strategies include buying at support or selling at resistance to profit from price movements. It’s key to know when to trade, especially if you’re using a funded account on Bybit or trying how to pass a prop challenge with a crypto trading firm.
Support and resistance are key price points where buying or selling happens a lot. Support stops a price drop, while resistance stops a price rise. These levels are key for trading strategies crypto. By marking important peaks and troughs on a chart, we can find strong support and resistance.
Crypto Trading Support resistance
Pivot points help find support and resistance levels. Calculating these uses formulas and moving averages like SMA and EMA. These tools are great for spotting where prices might stop moving.
- Trendlines: Great for finding support and resistance in crypto trading.
- Round Numbers: Prices like $20,000 or $10.50 are often key support and resistance points.
- Volume: High volumes at certain prices show strong support or resistance.
- Multiple Time Frames: Using charts for 4-hour, 1-hour, and 15-minute periods helps spot support and resistance.
False breakouts can be tricky. Waiting for price confirmation before trading is crucial. Moving averages and checking the RSI for overbought or oversold conditions near support or resistance can help make better trades.
Finally, set take-profit orders just before the next big resistance for longs and just above the next support for shorts. Knowing and using these strategies can boost our trading success in the crypto market.
Techniques for Finding Support and Resistance Zones
Learning to spot support and resistance zones is key for crypto traders. These zones show where buyers and sellers are active. Historical price data is crucial for finding these levels.
Crypto Trading Support resistance
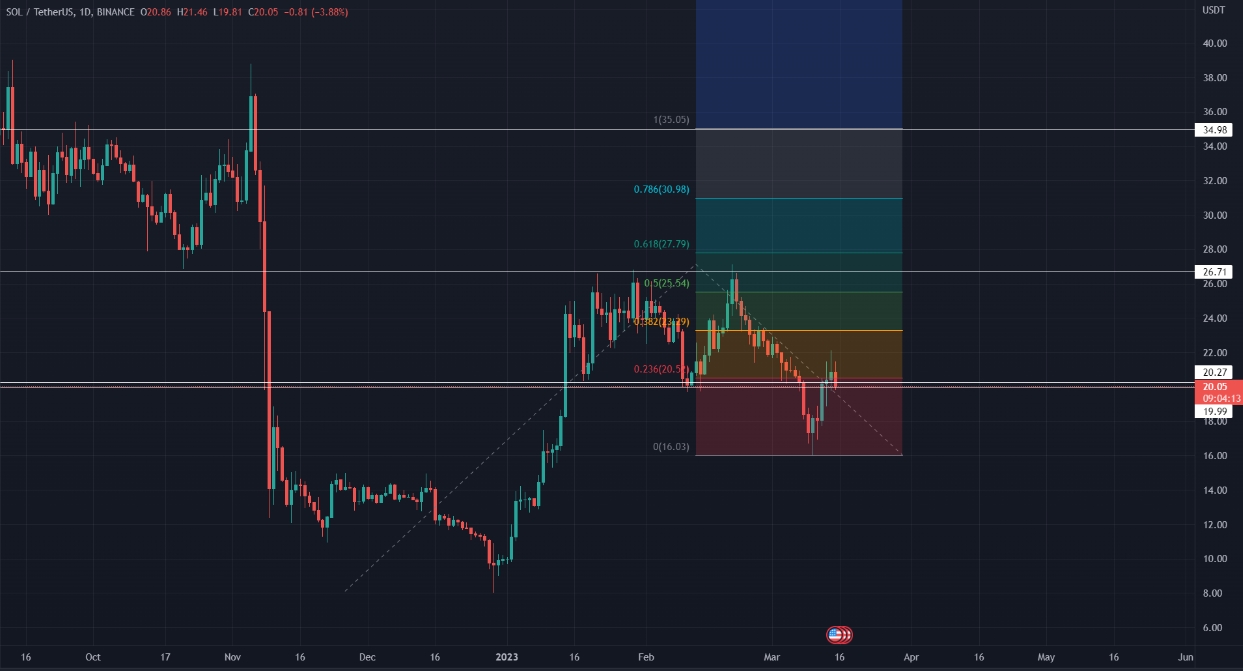
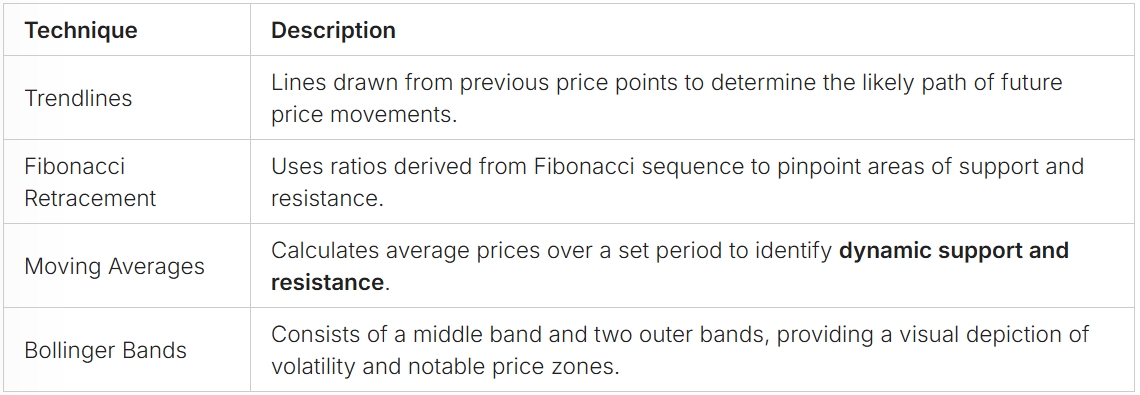
Using trendlines is a good way to find these zones. These lines connect past price highs and lows. They show where prices might stop or turn around. Tools like Fibonacci retracement and moving averages also help pinpoint these areas.
We use moving averages to spot short and long-term support and resistance. Tools like Bollinger Bands and Fibonacci ratios are also useful. They show where trading is likely to be busy due to price changes.
Combining trading charts, historical data, and technical indicators makes finding support and resistance more accurate. This helps traders make better decisions. Tools like TradingView help traders see these zones clearly, making trading in the crypto market easier.
Trading Strategies Based on Support and Resistance
Understanding support and resistance levels is key for trading in the crypto market. These levels are set when the price is rejected at least twice. They help traders make smart buy and sell decisions.
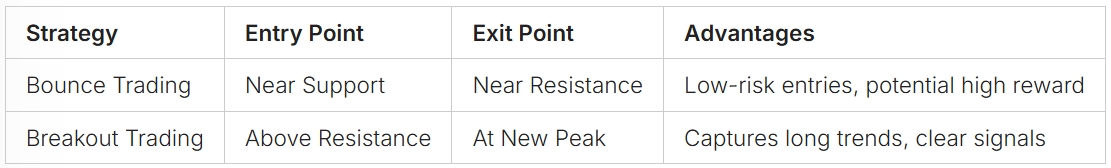
The bounce trading strategy is a popular choice. Traders buy when the price bounces off support or sell when it hits resistance. This method relies on the idea that these levels are reliable for entering and exiting trades.
The breakout trading strategy is also widely used. Traders buy when the price breaks through resistance, expecting a rise. Selling when the price drops below support signals a fall. It’s wise to confirm these breakouts to reduce risks. Using stop-loss orders helps protect profits and limit losses.
Having a risk management crypto trading plan is crucial. Trailing stop-loss orders help secure profits and limit losses. This approach is essential for both strategies.
The bounce and breakout strategies simplify crypto trading. They offer clear entry and exit points. These are based on the idea that past price levels, like 0.9000 or 1.1000, will affect future prices.
Advanced Support and Resistance Concepts
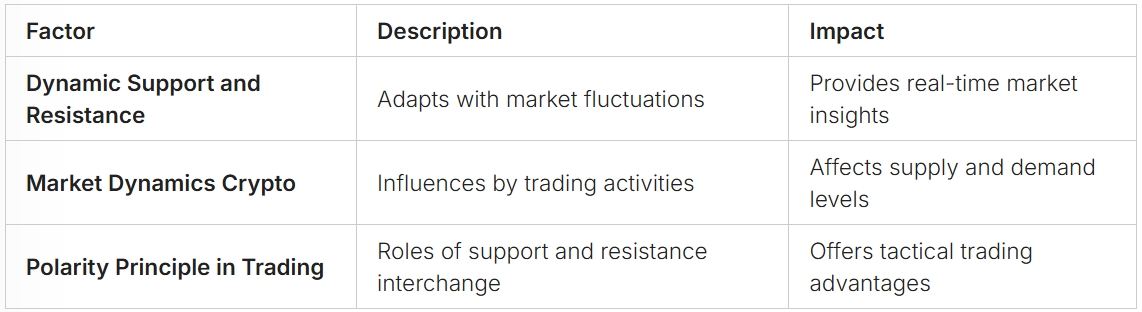
In the world of cryptocurrency trading, knowing how support and resistance change with market activity is key. These levels aren’t fixed; they move, showing us the market’s current state. By watching these shifts, traders can spot real-time trends.
Crypto Trading Support resistance
Support and resistance are more than just lines on a chart. They’re where big buying or selling happens, shaped by trader psychology. The polarity principle says that when a resistance level is broken, it often turns into support, and vice versa.
Key Factors:
- Trading at support or resistance offers favourable risk-to-reward ratios.
- These levels are key in understanding market psychology and supply and demand.
- Stop-loss orders should be placed carefully, using these levels as a guide but not directly on them.
- Support tends to break in a downtrend, while resistance tends to break in an uptrend.
- Price action shows how strong support or resistance levels are, affecting trading decisions.
Methods for Drawing Support and Resistance in Crypto:
- Psychological S&R: Identifying round numbers, 52-week highs and lows.
- Price Action Formations: Watching for natural price movements like price gaps and congestion zones.
- Market Structure Projection: Spotting swing pivots through peaks and troughs.
- Volume Formations: Using market interest, especially extreme or concentrated volumes.
- Computed Levels: Using moving averages, volatility bands, and calculated pivots.
- Projected with Computation: Combining market structure analysis with calculations like Fibonacci retracements.
Understanding the dynamic nature of support and resistance is crucial for trading success in cryptocurrency. Remembering the polarity principle, where these levels change roles, gives deeper insights and better strategies for the markets.
Tools to Enhance Your Support and Resistance Analysis
To improve trading, using advanced tools for support and resistance analysis is key. Tradingview offers many features that boost a trader’s toolkit. These tools help plot important support and resistance levels. They are the horizontal lines below or above the current price
Advanced charting tools give traders clear visual aids. They help see and predict market moves better. Adding mathematical tools like moving averages and Fibonacci lines helps find dynamic support and resistance.
Conclusion
Mastering support and resistance in crypto trading shows a trader’s grasp of market psychology and strategic thinking. These tools help traders deal with the ups and downs of cryptocurrencies. They make it easier to manage risks and make smart choices to increase profits.
Support and resistance levels are key to spotting market trends and understanding supply and demand. They mark where buying or selling slows down a price change. Using these levels wisely can lead to success in trading.
Identifying these levels involves looking at highs and lows, moving averages, and trendlines. Knowing when support turns into resistance is also crucial. These skills are vital for a good trading strategy. They improve a trader’s ability to handle market changes and make the most of them.
FAQ
What are support and resistance levels in crypto trading?
Support and resistance levels are key price points on a trading chart. They show where the price of a cryptocurrency tends to stop and reverse. Support acts as a price floor preventing further decline, while resistance acts as a ceiling preventing further rise. These concepts help traders make educated trading decisions.
Why are support and resistance important for crypto traders?
Support and resistance are crucial for forecasting price reversals and large price movements. They provide trading signals for setting strategic entry and exit points. This optimises risk-reward ratios and enhances risk management practices.
How can I trade support and resistance levels effectively?
To trade support and resistance levels well, tailor your strategies to market sentiment. Buy at support levels or sell at resistance levels. Consider potential breakouts or breakdowns.
What techniques can be used to identify support and resistance zones?
Identifying support and resistance zones involves analysing trading charts with historical price data. Use trend lines and technical indicators like moving averages. Consistency and the confluence of multiple indicators are key to accurate identification.
What trading strategies utilise support and resistance levels?
Strategies like bounce trading and breakout trading are effective. Bounce trading involves buying an asset when its price rebounds from the support level. Breakout trading is initiated when a price surpasses resistance, signalling a robust trend. Risk management techniques like a trailing stop-loss are essential to minimise losses and lock in profits.
What are dynamic support and resistance levels?
Dynamic support and resistance levels adapt and move, often seen in moving averages. They provide real-time insights into market trends. Understanding how these levels evolve, such as when former resistance becomes new support post-breakout, enriches a trader’s tactical repertoire.
What tools can enhance my support and resistance analysis?
Advanced tools for support and resistance analysis include platforms like Kriptomat. They offer features like advanced charting for plotting key levels, portfolio analytics for performance assessment, and automated trading solutions such as recurring buys and intelligent portfolios.
What are common pitfalls to avoid when trading support and resistance levels?
Common pitfalls include misidentifying support and resistance levels, remaining inflexible to market shifts, and neglecting risk management measures. Mitigation involves a comprehensive understanding of support and resistance functions, verifying with multiple indicators, and staying vigilant to changing market conditions.